ADO.Net rounding the DateTime parameter

I have been trying to debug a bug that was causing the records being returned out of the date window. It took me some time to realize that ADO.Net was rounding the C# DateTime and that was causing the invalid records to be returned.

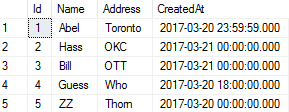
My table looks somewhat like this:

blogpost1

and the code was:

using (SqlConnection conn = new SqlConnection("server=localhost\\SQLExpress;Database=TestDB;Trusted_Connection=True"))
using (SqlCommand cmd = new SqlCommand("SELECT * FROM MyTestTable WHERE CreatedAt <= @dateTimeParameter", conn))
{
if(conn.State != ConnectionState.Open) conn.Open();
DateTime dtParameter = new DateTime(2017,03,20);
dtParameter = dtParameter.AddDays(1).AddTicks(-1); //The last moment on particular date
cmd.Parameters.Add(new SqlParameter("@dateTimeParameter", SqlDbType.DateTime) {Value = dtParameter});
DataTable dt = new DataTable();
dt.Load(cmd.ExecuteReader());
}

With this code in place, I was trying to get the records for the last moment on March 20th. I ended up using the following code to get the last moment on the particular date.

DateTime dtParameter = new DateTime(2017,03,20);
dtParameter = dtParameter.AddDays(1).AddTicks(-1);

But when this code was executed, I got the records for the next day as well, which was clearly not intended. I tried SqlDateTime type as parameter, but it still had the same effect.

 var sqlDateTime = new SqlDateTime(dtParameter);
 cmd.Parameters.Add(new SqlParameter("@dateTimeParameter", SqlDbType.DateTime) { Value = sqlDateTime });

One thing I noticed using SqlDateTime is that the Ticks rounded to 636256512000000000 from 636256511999999999, during the conversion.

This forced me to look at the reference code for SqlDateTime, the constructor called method to get SqlDateTime from DateTime, at the end of method chain, I found the method with the following comment

// Convert from TimeSpan, rounded to one three-hundredth second, due to loss of precision
        private static SqlDateTime FromTimeSpan(TimeSpan value) {

This was the reason the DateTime was getting rounded to the next day. The fix was to use Milliseconds to get the last moment of the day. Even passing a single millisecond wasn’t enough , I had to use 2.

   dtParameter = dtParameter.AddDays(1).AddMilliseconds(-2);

This fixed the issue and I was able to get the records for the date window.

Offline mapping in Windows applications using C#

Imagine a windows desktop computer without internet access that should have the ability to show maps and perform spatial operations(routing, navigation, searching etc), this would require offline mapping application.

Creating an offline mapping solution for windows application is rare and should be avoided. I say, should be, because there are alternatives to developing an offline mapping solution from the scratch. Having said that, there are some possible ways for doing it. Few things to consider are:

Data

Data in GIS applications is of type Vector or Raster. We will be dealing with Vector data in this article. (See Vector vs Raster data in GIS)

One of the starting point is to collect offline data.

  1. You can ask TeleAtlas, NAVTEQ to provide offline data. This will involve licencing fee and NDA. This option could cost a lot
  2. The other options is to use http://www.openstreetmap.org, Download its data and then work with it.

The other thing to consider is the data format. There are number of formats available to work in GIS applications. You can either use a proprietary one, or Shapefile format which is ESRI standard.

Application Development

After selecting data, the next step is to plan for application development. There should be three major steps involved in development of a mapping application.

  • Reading Data
  • Rendering data (geometries)
  • Optimization

First step starts with writing code to read/access data from offline source. This could be a ShapeFile or data stored in Spatial database like PostGIS, Spatialite etc. The approach should be to read data and store in appropriate objects for point, line and polygons.

Once the data is read into objects, the next step is rendering that data on screen, This involves converting geographical coordinates to 2D or 3D map projections on screen. Here is an excellent code project article about it: Writing GIS and Mapping Software for .NET. After transformation of data, the transformed objects are converted to geometry objects and placed on WinForm or WPF window. This might involve a bit of reading about GDI, DirectX, OpenGL or a simpler version of System.Drawing in WinForm or geometry drawing in WPF.

Later comes the optimization part. Map data is usually huge and consists of millions of geometries for a city/metropolis. The optimization in reading and more importantly rendering usually requires lots of work.

Layering

There has to be a layering technique involved and then how to show a limited number of geometries. Take an example of google maps, When you are viewing google maps at country level, you can only see city names, city/state/province boundaries, major roads etc, but it doesn’t show street level details. But as soon you start zooming in, one can see the details getting higher and higher. A similar approach could be used in displaying offline maps.

  • Layers for City names (major Point of interest) (Points)
  • Layer for Country/City polygon (Polygon)
  • Layer for major road networks (Line strings)
  • Layer for intercity highways (Line strings)
  • Layer for street level roads (Line strings)
  • Point of interest at street level (Points)

Once the data is setup in these layers, the application can use defined rules to show layer at a specific zoom level. Remember showing geometries is resource intensive, so only show that would be useful at a particular zoom level. For example if zoom levels are defined 1 to 10, where 10 is the highest zoom level, where the whole country would be visible in the application, then at zoom level 10 there is no need to show street level roads or even inter city highways.

Geometry Normalization

After determining the layers and their respective zoom level, there is another optimization technique that I have used in a similar application. That is to normalize geometrical data. For example a major highway line string contains 1 million points connected with each other forming a line string. The reason that particular geometry has so many points is to provide accurate information for navigation, but, these many points would be irrelevant if the major highway is show at the highest zoom level. A normalized geometry object could be used.

normailzedroad

The diagram above shows original line string in blue colour, which would have a lot of points, and the red geometry shows normalized geometry with lot fewer points. This could be used at the highest zoom level for showing highways.

Open Source alternatives

There are few open source projects which does the exact same thing and much more. They are:

There are other controls which are available for some licencing fee: